Optimizing Splunk Event Collection with PacketRanger

Data is the Problem
Optimizing Splunk Event Collection : It is no secret that data generation and storage is a problematic affair for any organization, and the growth of data show no signs of slowing anytime soon. IDC estimates that worldwide data creation will reach 175 zettabytes by 2025 with a compound annual growth rate of 23%. What’s interesting about these numbers is that in any given year only 2% of the data created is saved or retained into the following year.
Representative of this data explosion, observability data is heading towards a tipping point. Observability data is the lifeblood for network and security operations teams. It is essential for understanding how an organization’s infrastructure and information systems are performing. Consequently, when an organization’s log and telemetry data become a gushing pipeline, it is nearly impossible to make sense of the data without the right tools and applications.
For many organizations, Splunk has become an irreplaceable tool that provides broad observability proficiency. Splunk is widely known for being data agnostic with a spectrum of features like data analytics, correlation, and automation. However, Splunk’s power and robustness for handling observability data comes at a significant expense. A poorly managed observability pipeline will result in excessive data ingested by Splunk, which increases Splunk license cost and compute resource consumption.
Splunk: Tuning for Event Collection
Splunk data collection is the foundation of any Splunk instance. While indexers, search heads, cluster and license masters are the most visible components in a Splunk deployment, data collection and aggregation make up the sprawling substructure that is arguably the most critical function in any Splunk deployment. Splunk refers to data collection as the first of three tiers in the Splunk Data Pipeline. The three tiers are:
- Data Input
- Indexing
- Search Management
At the data input tier are Splunk Forwarders. Splunk has 2 types of forwarders:
- Universal Forwarder (UF)
- Heavy Forwarder (HF)
Splunk Forwarders are the keystone to a properly functioning Splunk instance. Poorly designed architecture and configuration issues at the data input tier can quickly escalate into a multitude of problems, from alerts and search performance to cluster stability and scaling.
Tuning for event collection must be planned and performed periodically or your Splunk instance will suffer. There are four factors that must be considered when tuning for event collection:
- Filtering
- Distribution
- Synchronization
- Reception
Event filtering and distribution are critical for scaling of indexes and searches. Time-based event synchronization must be achieved for effective event correlation. Finally, events must be received and processed in a timely manner for efficient and effective alert notifications.
PacketRanger, Tavve’s intelligent observability data broker, reduces the chaos that is often associated with Splunk event collection. PacketRanger enables the optimization of management applications (reducing the spend on management applications such as Splunk), and offers visibility into data pipelines through statistical analysis, empowering organizations to make better decisions, faster.

This white paper will explore common issues when tuning for event collection in Splunk, and how Tavve’s PacketRanger can identify and resolve many of the problems at the Splunk data input tier. Specifically, we will focus on event filtering and distribution.
Event Filtering and Distribution
Poor event filtering and distribution will wreak havoc in a Splunk cluster whether due to network congestion and/or pipeline saturation. Amongst others, these problems can be caused by device misconfigurations, network and device issues, unplanned traffic spikes, excessive ingestion rates.
Filtering unneeded events is paramount to keeping Splunk performing optimally, reducing event delay, as well as helping to reduce Splunk license costs and compute resources. When Splunk indexes data it transforms the data into events. During the indexing process, Splunk attaches metadata to the event. As a result, indexed data can be three times the size of the original raw data.
Because Splunk initially collects events as a data stream, filtering events in Splunk can only be performed after the data stream has been parsed. This often happens at the Indexer tier. This means that at the Data Input tier every event or message, regardless of its value or importance, is passed through Splunk Universal Forwarders (UF) before being passed to Indexers. The Indexer must parse the data stream before applying any event filters. Consequently, filtering events on the Indexer increases the compute resources necessary to manage the event volume. This can introduce event delay into your data pipeline.
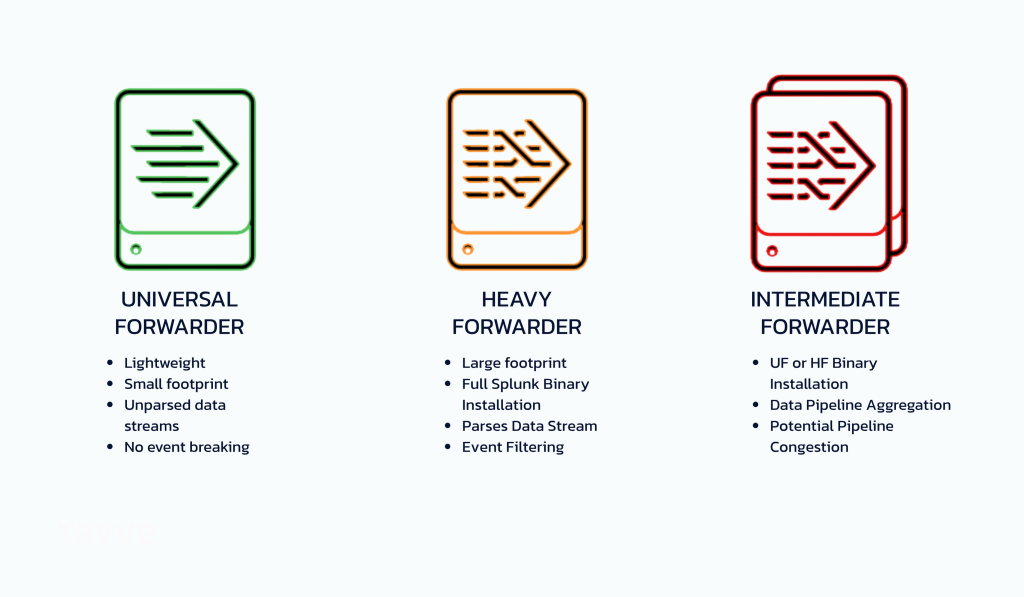
Figure 1 – Splunk Forwarders
Universal Forwarders (UF) work with unparsed data streams rather than events. A UF has some ability to forward events based on data types, namely Windows Event Collection, but the ability to filter and forward on specific events does not exist in a Splunk Universal Forwarder.
To filter events at the Data Input tier a Splunk Heavy Forwarder (HF) is needed to parse data. However, as the name would imply, a HF has a rather large footprint over a UF, retaining the capabilities of a Splunk Indexer. While a HF can filter and route data using criteria such as source and type of event, it is not always the best tool for the job. A HF suffers from the same limitation as filtering on an Indexer due to its excessive I/O, modifying the data as part of the indexing process, and its proximity to source devices in the network.
To illustrate this point, a common method for ingesting syslog data into Splunk will be used. It is worth noting that the syslog example represents a single data source type. Event tuning across additional data sources and formats face similar challenges. Perhaps even more challenging is the lack of centralized aggregation for these disparate telemetry and log data formats, which can reduce the overall visibility into an organization’s data pipeline.
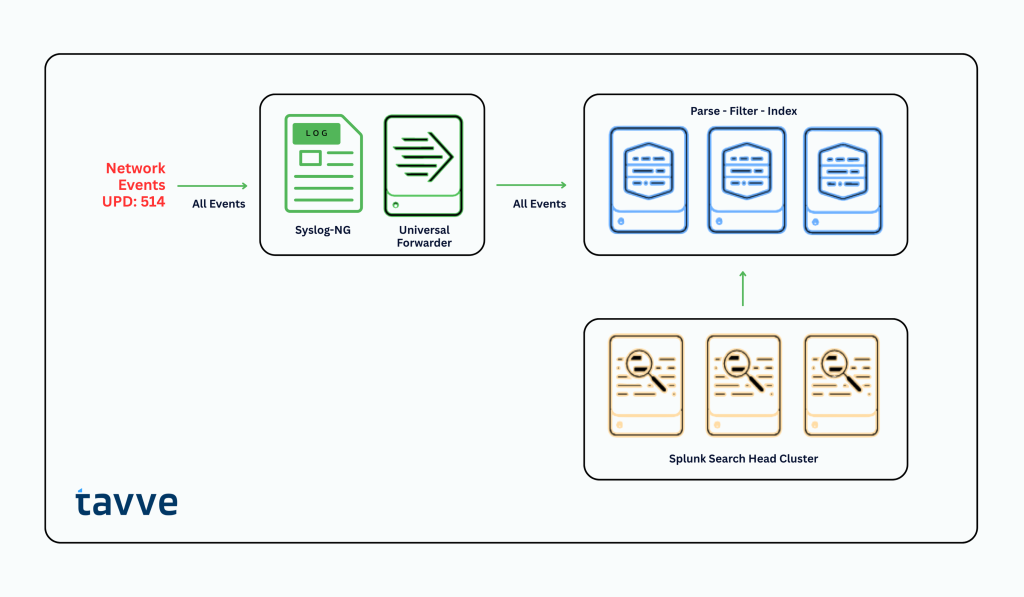
Figure 2 – Syslog-NG and Splunk
Syslog-NG, or an alternative like rsyslog, is used to aggregate syslog data sent from source devices over the network. A UF is installed on the Syslog-NG server where it monitors and reads the log file for new data. The UF’s only job is to create the data stream that is sent to either an Intermediate Heavy Forwarder (HF) or a Splunk Indexer. Notice the term data is used rather than event or message. This is because the lightweight function of the UF does not have the capability to parse data at the event level.
It is not until the data stream is sent to the HF or Indexer that a filter can be utilized. While filtering at the Indexer tier is possible, which will reduce Splunk license costs and could improve Search Head performance, it has not addressed the pipeline congestion and event delay that occurs earlier at the Data Input tier.
Another strategy would be to implement filtering on the Syslog-NG server. This is a valid strategy for environments with low event volumes. However, for environments with high event volumes, especially when using complex filtering with regular expressions, the additional resources needed on the syslog server are prohibitive. There is also the complexity to consider when configuring Syslog-NG for redundancy and high availability.
The above example only addresses syslog data. The complexity is compounded further when filtering across all types of log and telemetry data, such as NetFlow, SNMP, JSON, etc. As a result, managing filtering rules across large, distributed environments where Splunk is ingesting disparate observability data will continue to be a growing challenge.
Tavve’s PacketRanger: Advanced Filtering and Forwarding
PacketRanger is a robust, solution to aggregate logs, metrics, and traces. Advanced filtering and forwarding capabilities provide the necessary flexibility to eliminate unneeded events, reducing data pipeline congestion at the Splunk Data Input tier. Additionally, PacketRanger’s analytics and reporting offer greater visibility into the Splunk data pipeline. This will drive better decision making on managing the data pipeline, and simplify efforts related to troubleshooting and performance tuning.

Figure 3 – PacketRanger Event Filtering
In Figure 3, PacketRanger is used for aggregating log and telemetry data from source devices. Centralizing logs, metrics and traces is an efficient and easy method for managing event filters across disparate sources and data types. This allows greater flexibility for the distribution of events across a Splunk environment, which will be covered in the next section on event distribution. For continuity, the syslog example used previously will be extended here as well.
Since PacketRanger is aggregating syslog data, the Syslog-NG server is not needed, and is removed from the path into Splunk. Syslog-NG can still receive raw syslog data. Such a use case might be required for data compliance reasons. In this example, PacketRanger is filtering and forwarding syslog messages, so that only the requisite event data is sent to Splunk. The Syslog-NG server is functioning as a system of record for compliance, so it receives 100% of the raw syslog data.
PacketRanger filters Syslog messages using several different criteria.
- Source IP: Source addresses of the data coming into PacketRanger. Multiple addresses may be entered when separated by commas and may use address patterns, such as wildcards.
- Hostname: Hostname of the device that generated the Syslog message. The search string can be a regular expression search.
- Program Name: Name of the program that generated the Syslog message. The search string can be a regular expression search.
- Message Search: Search string that the Syslog message must or must not contain.
- Syslog Severity: Syslog messages of the specified severity or lower. This includes Cisco specific syslog severities.
- Syslog Facility: Syslog messages of the specified facility
Filters can be configured to exclude or include events that match the filter conditions. PacketRanger sends the filtered syslog data directly into Splunk. The reception of the syslog data into Splunk can be performed by a UF, HF or Indexer. Choosing the appropriate point of ingestion depends on several factors, such as Data Input tier architecture, Indexer and Search Head cluster configuration, and search head performance.
The above example highlights filtering syslog data, but PacketRanger is equally capable filtering many other logs, metrics, and traces. For example, PacketRanger can filter SNMP data with conditions for trap OID, variable binding, agent, SNMP version, community string, as well as nested filters. Likewise, PacketRanger can filter NetFlow with a set of filter conditions to remove flow data from a given NetFlow packet, which helps to optimize applications limited by flow-based licenses, like Cisco StealthWatch. Each NetFlow filter condition is composed of a combination of Source Address, Destination Address, Destination Port, Protocol, and Template ID. PacketRanger’s filtering capabilities enables complete control over the data that gets sent to Splunk.
Now let’s look at PacketRanger’s rule-based data forwarding and analytics, and how the combination of filtering, forwarding and statistical analysis can optimize Splunk event distribution.
Event Distribution
Good event distribution is necessary for Splunk to perform optimally, which reduces event and alert delay. Poor event distribution can cause two common issues in Splunk: sticky forwarders and overloaded forwarders. Splunk forwarders are designed to balance the event load across a cluster of indexers. A Splunk Universal Forwarder (UF) becomes sticky when it is locked onto a single indexer. This happens when the UF is dealing with very large files and continuous data streams, and the UF is unable to distinguish event boundaries.
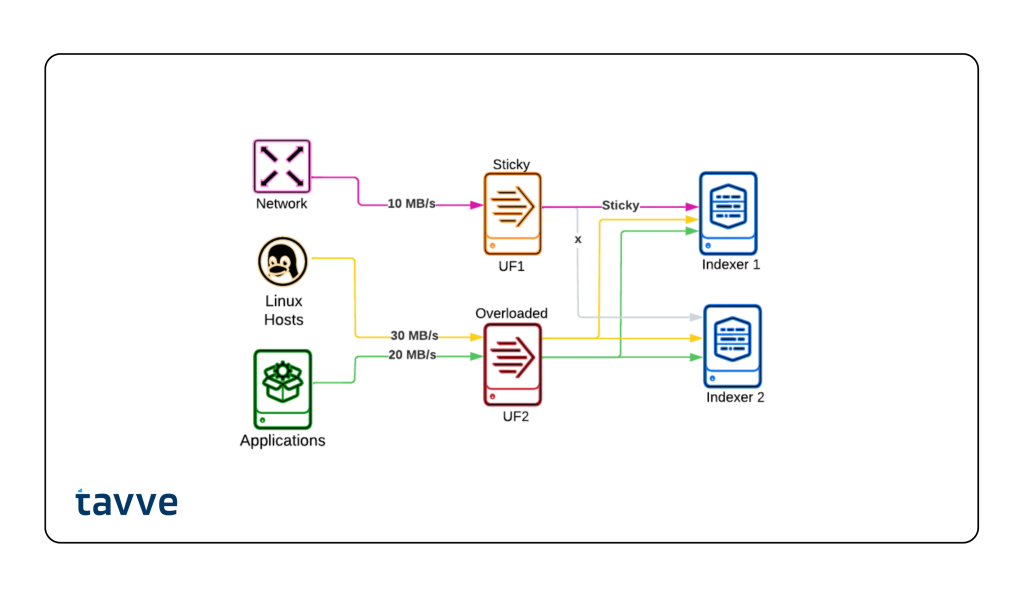
Figure 4 – Sticky and Overloaded Forwarders
A forwarder that is overloaded will often represent the lion’s share of data being sent to a Splunk cluster, which will result in the event pipeline being saturated. It is common that some imbalance and disproportion will exist between forwarders, especially in today’s rapidly changing cloud and network environments. Sticky and overloaded forwarders will cause event delay, improper event distribution and poor search execution times.
Splunk offers some methods and techniques to improve event distribution and reduce the occurrence of sticky and overloaded forwarders. Configuring Splunk with event breakers per source type, using auto load balancing based on volume, increasing load balance frequency and time-based load balancing will help reduce the incidence of forwarder issues. However, as networks and applications evolve over time, even the best defined Splunk architecture and configuration will experience forwarder issues.
For example, In Figure 4 above, UF2 is overloaded due to excessive syslog data being generated from Linux hosts and applications. Despite being properly architected and configured, over time the growth and demand on the network can outpace the original capacity of the Data Input tier.
There are two ways to solve this issue:
- Some may look to increase the compute resources on UF2 to handle the increased event volume. This might be an easy fix if UF2 is virtualized, and enough resources exist on the host. However, this ignores the potential issue that UF1 could be underutilized.
- Perhaps, then, a better solution is to redistribute some of the event volume from the Linux hosts from UF2 into UF1.
Based on the example in Figure 4, it’s clear that UF1 is underutilized, and redistributing the event load across both UF’s is the better option. However, while redistribution of the event load might be a better solution, the effort associated with reconfiguring hundreds or thousands of source device to send syslog data to UF1 is formidable and often underestimated.
PacketRanger: Rules-Based Forwarding
Tavve makes event distribution quick and easy! PacketRanger’s rules-based forwarding provides a simple, efficient, and affordable method to forward event data based on configurable criteria. Simply put, forwarding rules define the source and destination information of the event data to be forwarded.
Forwarding rules are defined by the following criteria:
- Type of log, metric or trace data (Syslog, SNMP, NetFlow, sFlow, etc.)
- Source addresses from which the event data originated
- Local port PacketRanger listens for the incoming data
- Destination hosts to which PacketRanger will forward the data
- Destination port on destination hosts to which PacketRanger will forward the event data
- Any filter conditions associated with the event data
The syslog example used throughout this article will be used here as well. The diagram in Figure 5 depicts Linux hosts representing the largest share of the event data. It is already been established that redistribution in the event volume between UF1 and UF2 is the preferred solution.

Figure 5 – PacketRanger Rules-Based Forwarding
With PacketRanger, no changes to source device configurations are needed. A forwarding rule can be created to split the event volume. This can be as simple as defining a subset of the source IP addresses to send their event data to either UF1 or UF2.
More complex rules can be setup using filters with regular expressions. While it’s already been established that filters can be applied to PacketRanger to remove unwanted event data, it is also possible to use filters to identify specific data that needs to be routed to a particular destination. For example, regular expressions can be used to search for specific conditions in the message field, program name, and/or hostname of a syslog event. It’s also possible to delineate based on the syslog severity or facility.
These powerful filtering and forwarding capabilities in PacketRanger are supported for many common logs, traces, and metrics. Additionally, since PacketRanger is the aggregator for all observability data, organizations now have greater flexibility in the distribution of event data, offering complete and dynamic control over their Splunk data pipeline.
PacketRanger: Statistical Analysis
PacketRanger’s statistical analysis and reporting provides visibility into the data pipeline. It presents critical analytics data to help drive better decisions.

Figure 6 – Statistical Dashboard
Statistical analysis dashboards, reporting and thresholds can help identify poor event distribution, and alert on overloaded Splunk Forwarders. If overloading problems are found on Splunk Forwarders, PacketRanger can help identify the offending source devices. It is even possible to discover which source devices are generating the most data. For example, if syslog severity were inadvertently set to debug, PacketRanger can identify the offending source devices, as well as the specific syslog messages that are saturating the data pipeline.
Thresholds can be defined in PacketRanger to alert on conditions that could saturate the data pipeline in Splunk. Thresholds can be set on specific traffic types, such as Syslog, SNMP and NetFlow. Likewise, individual device thresholds by traffic type can also be set to alert when an individual device is sending unusual amounts of data.
Summary
It is often said that data without context has no meaning. Splunk’s purpose is to add context to the data that security and operations teams depend on to monitor and manage complex networks and information systems. An unfortunate side effect of adding context to data is the ability to store and analyze the data. This translates to increasing Splunk licensing and compute resources, not to mention the burden placed on those whose responsibility it is to manage such large data stores.
Proper management of the observability pipeline is necessary to optimize Splunk’s performance, reduce license costs and minimize compute resource consumption. Tavve’s PacketRanger can reduce the size of the data pipeline before entering Splunk’s Data Input tier by filtering unneeded event data. Not only does this shrink Splunk license costs, but filtering can improve search query performance, and reduce pipeline congestion that cause alert delays.
Finally, PacketRanger’s rules-based forwarding can help improve event distribution across Splunk Forwarders. By aggregating events with PacketRanger, configuration changes on source devices are eliminated when tuning for event distribution. Statistical analysis and dashboards are essential tools to gain better visibility into how telemetry and log data are flowing across the network. This empowers organizations to make better decisions, faster.
